
说明
需要修改好才能用于实际环境中
Prometheus 自身监控
普罗米修斯实例宕机
- alert: PrometheusJobMissing
    expr: absent(up{job="prometheus"})
    for: 0m
    labels:
      severity: warning
    annotations:
      summary: Prometheus job missing (instance {{ $labels.instance }})
      description: "A Prometheus job has disappeared\n  VALUE = {{ $value }}\n  LABELS = {{ $labels }}"
普罗米修斯目标离线
  - alert: PrometheusTargetMissing
    expr: up == 0
    for: 0m
    labels:
      severity: critical
    annotations:
      summary: Prometheus target missing (instance {{ $labels.instance }})
      description: "A Prometheus target has disappeared. An exporter might be crashed.\n  VALUE = {{ $value }}\n  LABELS = {{ $labels }}"
普罗米修斯所有目标离线
  - alert: PrometheusAllTargetsMissing
    expr: count by (job) (up) == 0
    for: 0m
    labels:
      severity: critical
    annotations:
      summary: Prometheus all targets missing (instance {{ $labels.instance }})
      description: "A Prometheus job does not have living target anymore.\n  VALUE = {{ $value }}\n  LABELS = {{ $labels }}"
Prometheus 配置重载失败
  - alert: PrometheusConfigurationReloadFailure
    expr: prometheus_config_last_reload_successful != 1
    for: 0m
    labels:
      severity: warning
    annotations:
      summary: Prometheus configuration reload failure (instance {{ $labels.instance }})
      description: "Prometheus configuration reload error\n  VALUE = {{ $value }}\n  LABELS = {{ $labels }}"
普罗米修斯重启次数过多
Prometheus 在过去 15 分钟内重启了两次以上。它可能是崩溃循环。
  - alert: PrometheusTooManyRestarts
    expr: changes(process_start_time_seconds{job=~"prometheus|pushgateway|alertmanager"}[15m]) > 2
    for: 0m
    labels:
      severity: warning
    annotations:
      summary: Prometheus too many restarts (instance {{ $labels.instance }})
      description: "Prometheus has restarted more than twice in the last 15 minutes. It might be crashlooping.\n  VALUE = {{ $value }}\n  LABELS = {{ $labels }}"
Prometheus AlertManager 配置重载失败
  - alert: PrometheusAlertmanagerConfigurationReloadFailure
    expr: alertmanager_config_last_reload_successful != 1
    for: 0m
    labels:
      severity: warning
    annotations:
      summary: Prometheus AlertManager configuration reload failure (instance {{ $labels.instance }})
      description: "AlertManager configuration reload error\n  VALUE = {{ $value }}\n  LABELS = {{ $labels }}"
Prometheus AlertManager 配置未同步
AlertManager集群实例配置不同步
  - alert: PrometheusAlertmanagerConfigNotSynced
    expr: count(count_values("config_hash", alertmanager_config_hash)) > 1
    for: 0m
    labels:
      severity: warning
    annotations:
      summary: Prometheus AlertManager config not synced (instance {{ $labels.instance }})
      description: "Configurations of AlertManager cluster instances are out of sync\n  VALUE = {{ $value }}\n  LABELS = {{ $labels }}"
Prometheus AlertManager E2E心跳
Prometheus DeadManSwitch 是一个始终触发的警报。它通过 Alertmanager 用作 Prometheus 的端到端测试。
  - alert: PrometheusAlertmanagerE2eDeadManSwitch
    expr: vector(1)
    for: 0m
    labels:
      severity: critical
    annotations:
      summary: Prometheus AlertManager E2E dead man switch (instance {{ $labels.instance }})
      description: "Prometheus DeadManSwitch is an always-firing alert. It's used as an end-to-end test of Prometheus through the Alertmanager.\n  VALUE = {{ $value }}\n  LABELS = {{ $labels }}"
普罗米修斯未连接到警报管理器
  - alert: PrometheusNotConnectedToAlertmanager
    expr: prometheus_notifications_alertmanagers_discovered < 1
    for: 0m
    labels:
      severity: critical
    annotations:
      summary: Prometheus not connected to alertmanager (instance {{ $labels.instance }})
      description: "Prometheus cannot connect the alertmanager\n  VALUE = {{ $value }}\n  LABELS = {{ $labels }}"
Prometheus 规则评估失败
Prometheus 遇到 {{ $value }} 规则评估失败,导致可能被忽略的警报。
  - alert: PrometheusRuleEvaluationFailures
    expr: increase(prometheus_rule_evaluation_failures_total[3m]) > 0
    for: 0m
    labels:
      severity: critical
    annotations:
      summary: Prometheus rule evaluation failures (instance {{ $labels.instance }})
      description: "Prometheus encountered {{ $value }} rule evaluation failures, leading to potentially ignored alerts.\n  VALUE = {{ $value }}\n  LABELS = {{ $labels }}"
Prometheus 模板文本扩展失败
Prometheus 遇到 {{ $value }} 模板文本扩展失败
  - alert: PrometheusTemplateTextExpansionFailures
    expr: increase(prometheus_template_text_expansion_failures_total[3m]) > 0
    for: 0m
    labels:
      severity: critical
    annotations:
      summary: Prometheus template text expansion failures (instance {{ $labels.instance }})
      description: "Prometheus encountered {{ $value }} template text expansion failures\n  VALUE = {{ $value }}\n  LABELS = {{ $labels }}"
普罗米修斯规则评估缓慢
Prometheus 规则评估花费的时间比预定的时间间隔多。它表示存储后端访问速度较慢或查询过于复杂。
  - alert: PrometheusRuleEvaluationSlow
    expr: prometheus_rule_group_last_duration_seconds > prometheus_rule_group_interval_seconds
    for: 5m
    labels:
      severity: warning
    annotations:
      summary: Prometheus rule evaluation slow (instance {{ $labels.instance }})
      description: "Prometheus rule evaluation took more time than the scheduled interval. It indicates a slower storage backend access or too complex query.\n  VALUE = {{ $value }}\n  LABELS = {{ $labels }}"
普罗米修斯通知积压
Prometheus 通知队列已经 10 分钟未为空
  - alert: PrometheusNotificationsBacklog
    expr: min_over_time(prometheus_notifications_queue_length[10m]) > 0
    for: 0m
    labels:
      severity: warning
    annotations:
      summary: Prometheus notifications backlog (instance {{ $labels.instance }})
      description: "The Prometheus notification queue has not been empty for 10 minutes\n  VALUE = {{ $value }}\n  LABELS = {{ $labels }}"
Prometheus AlertManager 通知失败
Alertmanager 发送通知失败
  - alert: PrometheusAlertmanagerNotificationFailing
    expr: rate(alertmanager_notifications_failed_total[1m]) > 0
    for: 0m
    labels:
      severity: critical
    annotations:
      summary: Prometheus AlertManager notification failing (instance {{ $labels.instance }})
      description: "Alertmanager is failing sending notifications\n  VALUE = {{ $value }}\n  LABELS = {{ $labels }}"
普罗米修斯目标为空
Prometheus 在服务发现中没有目标
  - alert: PrometheusTargetEmpty
    expr: prometheus_sd_discovered_targets == 0
    for: 0m
    labels:
      severity: critical
    annotations:
      summary: Prometheus target empty (instance {{ $labels.instance }})
      description: "Prometheus has no target in service discovery\n  VALUE = {{ $value }}\n  LABELS = {{ $labels }}"
普罗米修斯目标抓取缓慢
普罗米修斯从数据导出器中抓取数据慢
  - alert: PrometheusTargetScrapingSlow
    expr: prometheus_target_interval_length_seconds{quantile="0.9"} > 60
    for: 5m
    labels:
      severity: warning
    annotations:
      summary: Prometheus target scraping slow (instance {{ $labels.instance }})
      description: "Prometheus is scraping exporters slowly\n  VALUE = {{ $value }}\n  LABELS = {{ $labels }}"
普罗米修斯scrape
Prometheus 有很多超出样本限制的scrape
  - alert: PrometheusLargeScrape
    expr: increase(prometheus_target_scrapes_exceeded_sample_limit_total[10m]) > 10
    for: 5m
    labels:
      severity: warning
    annotations:
      summary: Prometheus large scrape (instance {{ $labels.instance }})
      description: "Prometheus has many scrapes that exceed the sample limit\n  VALUE = {{ $value }}\n  LABELS = {{ $labels }}"
普罗米修斯目标抓取重复
Prometheus 有许多样本由于时间戳重复但值不同而被拒绝
  - alert: PrometheusTargetScrapeDuplicate
    expr: increase(prometheus_target_scrapes_sample_duplicate_timestamp_total[5m]) > 0
    for: 0m
    labels:
      severity: warning
    annotations:
      summary: Prometheus target scrape duplicate (instance {{ $labels.instance }})
      description: "Prometheus has many samples rejected due to duplicate timestamps but different values\n  VALUE = {{ $value }}\n  LABELS = {{ $labels }}"
Prometheus TSDB 检查点创建失败
Prometheus 遇到 {{ $value }} 检查点创建失败
  - alert: PrometheusTsdbCheckpointCreationFailures
    expr: increase(prometheus_tsdb_checkpoint_creations_failed_total[1m]) > 0
    for: 0m
    labels:
      severity: critical
    annotations:
      summary: Prometheus TSDB checkpoint creation failures (instance {{ $labels.instance }})
      description: "Prometheus encountered {{ $value }} checkpoint creation failures\n  VALUE = {{ $value }}\n  LABELS = {{ $labels }}"
Prometheus TSDB 检查点删除失败
Prometheus 遇到 {{ $value }} 检查点删除失败
  - alert: PrometheusTsdbCheckpointDeletionFailures
    expr: increase(prometheus_tsdb_checkpoint_deletions_failed_total[1m]) > 0
    for: 0m
    labels:
      severity: critical
    annotations:
      summary: Prometheus TSDB checkpoint deletion failures (instance {{ $labels.instance }})
      description: "Prometheus encountered {{ $value }} checkpoint deletion failures\n  VALUE = {{ $value }}\n  LABELS = {{ $labels }}"
Prometheus TSDB 压缩失败
Prometheus 遇到 {{ $value }} TSDB 压缩失败
  - alert: PrometheusTsdbCompactionsFailed
    expr: increase(prometheus_tsdb_compactions_failed_total[1m]) > 0
    for: 0m
    labels:
      severity: critical
    annotations:
      summary: Prometheus TSDB compactions failed (instance {{ $labels.instance }})
      description: "Prometheus encountered {{ $value }} TSDB compactions failures\n  VALUE = {{ $value }}\n  LABELS = {{ $labels }}"
Prometheus TSDB 头部截断失败
Prometheus 遇到 {{ $value }} TSDB 头部截断失败
  - alert: PrometheusTsdbHeadTruncationsFailed
    expr: increase(prometheus_tsdb_head_truncations_failed_total[1m]) > 0
    for: 0m
    labels:
      severity: critical
    annotations:
      summary: Prometheus TSDB head truncations failed (instance {{ $labels.instance }})
      description: "Prometheus encountered {{ $value }} TSDB head truncation failures\n  VALUE = {{ $value }}\n  LABELS = {{ $labels }}"
Prometheus TSDB 重新加载失败
Prometheus 遇到 {{ $value }} TSDB 重载失败
  - alert: PrometheusTsdbReloadFailures
    expr: increase(prometheus_tsdb_reloads_failures_total[1m]) > 0
    for: 0m
    labels:
      severity: critical
    annotations:
      summary: Prometheus TSDB reload failures (instance {{ $labels.instance }})
      description: "Prometheus encountered {{ $value }} TSDB reload failures\n  VALUE = {{ $value }}\n  LABELS = {{ $labels }}"
普罗米修斯 TSDB WAL 损坏
Prometheus 遇到 {{ $value }} TSDB WAL 损坏
  - alert: PrometheusTsdbWalCorruptions
    expr: increase(prometheus_tsdb_wal_corruptions_total[1m]) > 0
    for: 0m
    labels:
      severity: critical
    annotations:
      summary: Prometheus TSDB WAL corruptions (instance {{ $labels.instance }})
      description: "Prometheus encountered {{ $value }} TSDB WAL corruptions\n  VALUE = {{ $value }}\n  LABELS = {{ $labels }}"
Prometheus TSDB WAL 截断失败
Prometheus 遇到 {{ $value }} TSDB WAL 截断失败
  - alert: PrometheusTsdbWalTruncationsFailed
    expr: increase(prometheus_tsdb_wal_truncations_failed_total[1m]) > 0
    for: 0m
    labels:
      severity: critical
    annotations:
      summary: Prometheus TSDB WAL truncations failed (instance {{ $labels.instance }})
      description: "Prometheus encountered {{ $value }} TSDB WAL truncation failures\n  VALUE = {{ $value }}\n  LABELS = {{ $labels }}"
完整配置
# 和上面一样,只是整理成一个文件了
您暂时无权查看此隐藏内容!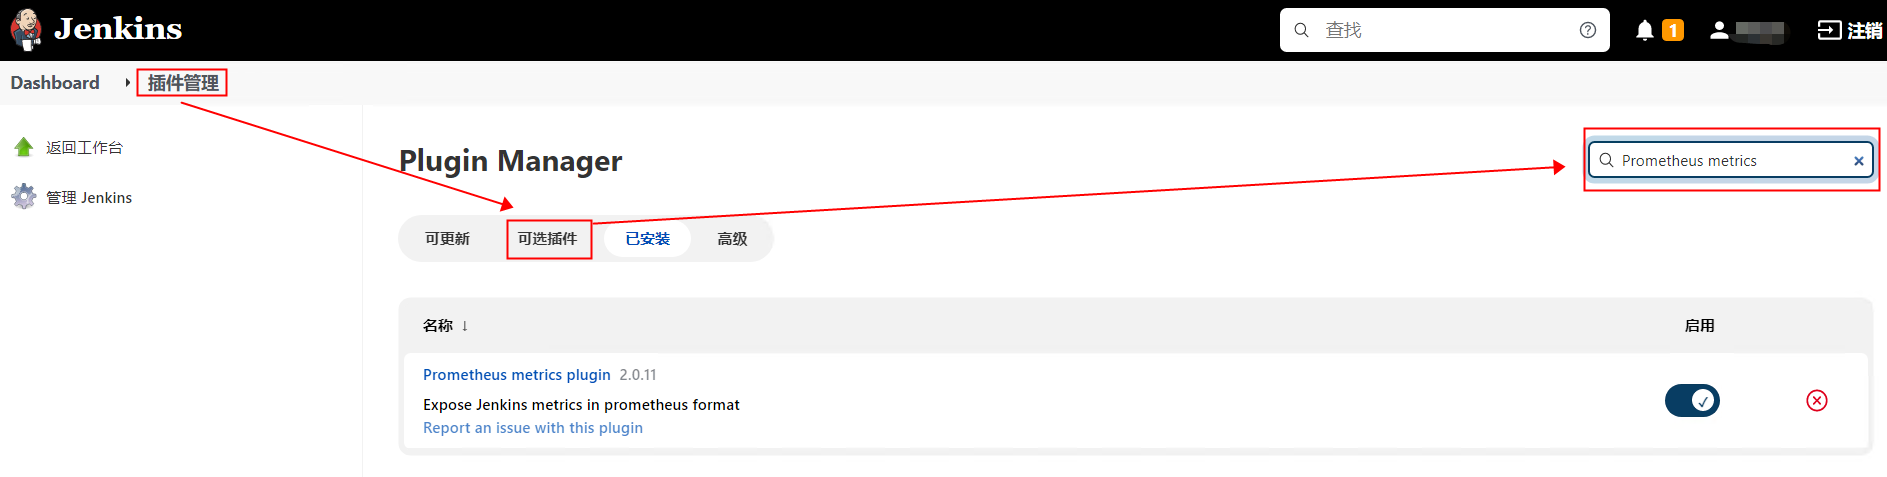


 Asynq任务框架
 MCP智能体开发实战
 WEB架构
WEB架构 安全监控体系


比较详细的生产实战案例